

Know Exactly How Your Molecule Is Doing Across the NHS.
If you make or market a molecule sold in England, you have two options. Pay six figures for syndicated data, or scrape NHSBSA CSVs yourself on a Tuesday afternoon.
Neither is a good use of your week.
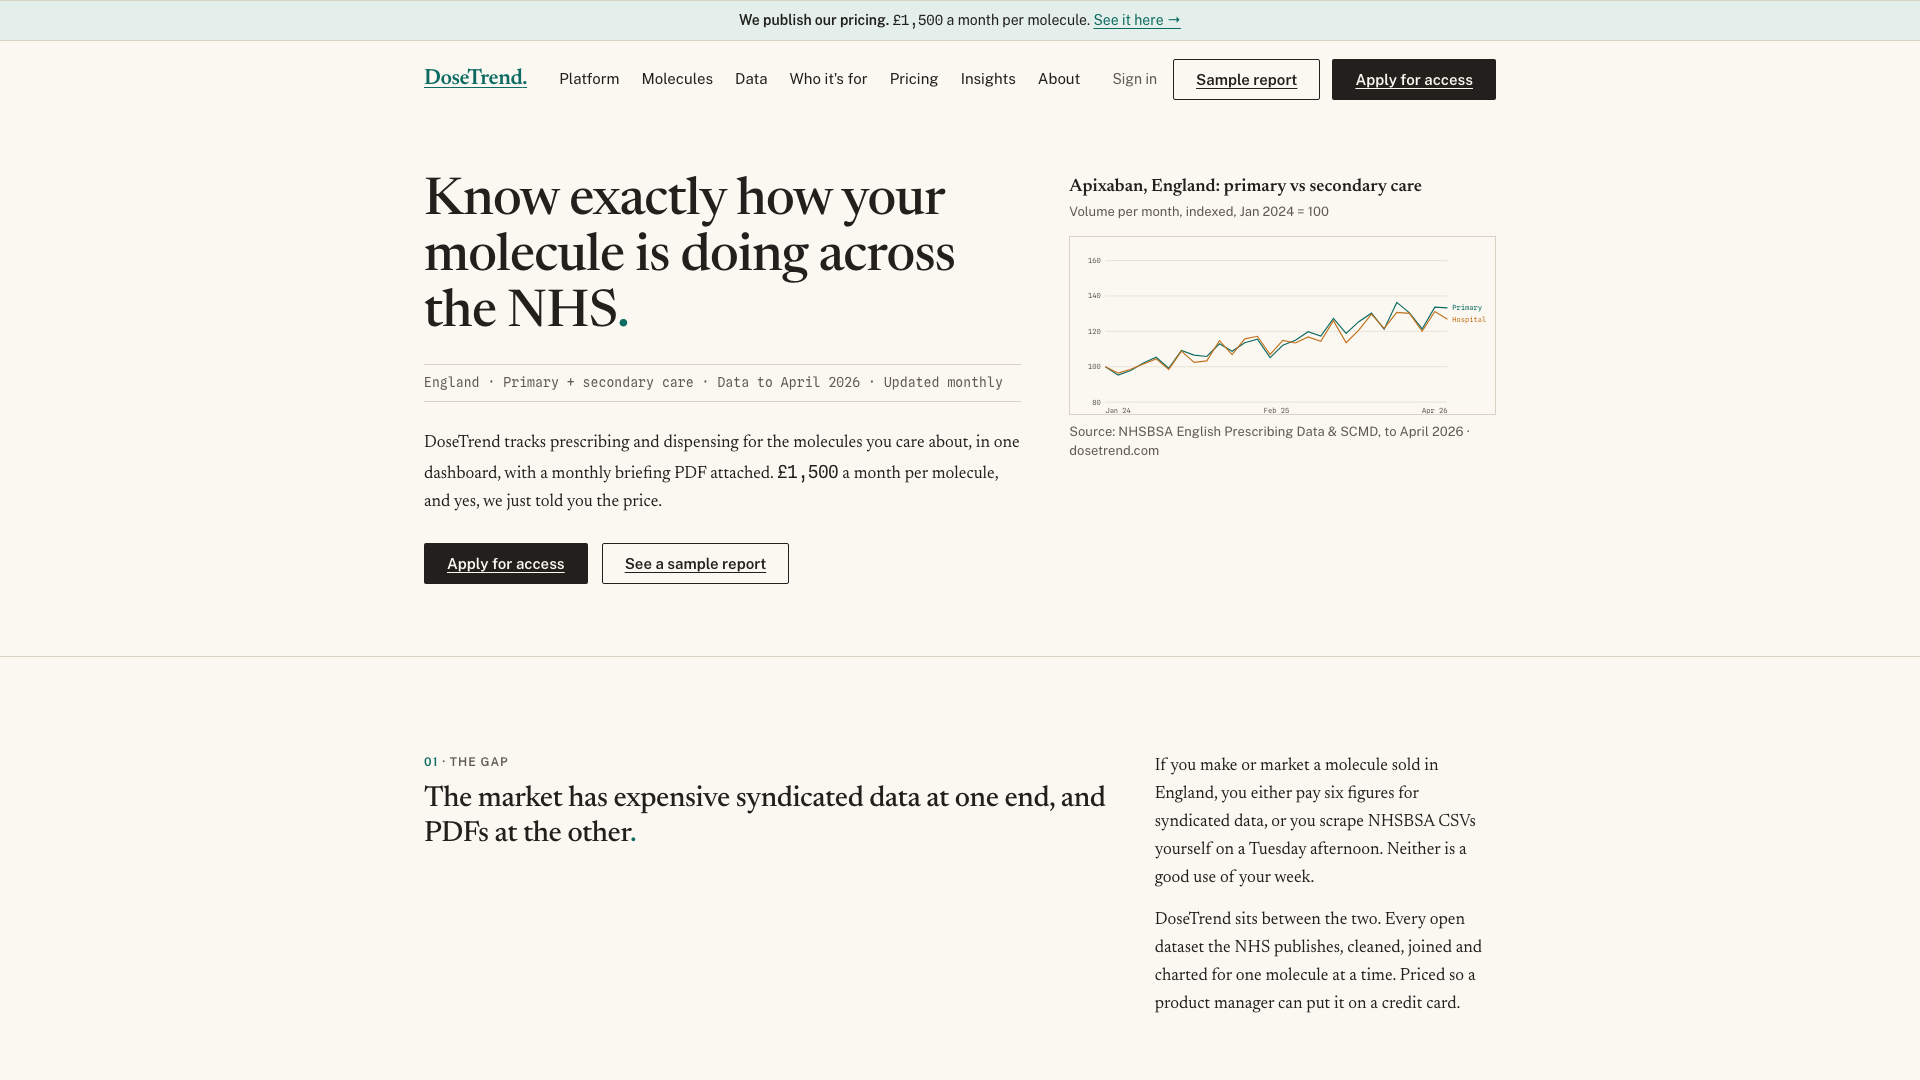
DoseTrend sits between the two. Every open dataset the NHS publishes, primary care and hospital alike, cleaned and joined and charted for one molecule at a time — with a written briefing in your inbox on the first working day of every month.

Why Not Just Pull the Data Yourself?
The NHS publishes an enormous amount of prescribing data, and every bit of it is free. That is exactly the problem:
It arrives as raw CSVs. Hundreds of megabytes a month, spread across primary care and hospital datasets that share neither a schema nor a naming convention.
The joining is the actual job. Primary and secondary care have to be reconciled before a single number means anything, and that reconciliation is where most in-house attempts quietly stall.
Syndicated data solves it for six figures. Fine if you have six figures and a procurement cycle spare. Absurd if you just need to know how one molecule is tracking this quarter.
What DoseTrend Does
Everything the open NHS data can tell you, already joined up.
Monthly Trend Analysis
Volume by month with indexed views, year-on-year comparisons and seasonality, so you can tell a real shift from ordinary noise.
ICB & Practice Detail
Break the national number down across all 36 Integrated Care Boards and 7,293 GP practices to find where the movement actually is.
Primary + Secondary Care
Hospital dispensing joined to primary care prescribing, so you are looking at the whole picture rather than half of it.
Monthly Briefing PDF
A written briefing from a human being, on the first working day of the month. Not an automated chart dump with your logo on it.
Seven Years of History
Data going back to 2019, so a trend has enough runway behind it to be worth acting on.
Unlimited Users
One price covers the whole company. Share it across brand, market access and analytics without counting seats.
Who Is DoseTrend For?
Product Managers
Who need to know how their molecule is tracking without waiting at the back of an analyst queue
Marketing & Brand Teams
Building a picture of where a product is growing, flat, or quietly losing ground
Market Access
Watching regional variation across ICBs and seeing formulary decisions play out in real prescribing
Commercial Analytics
Who want the NHS open data cleaned and joined already, instead of rebuilding that pipeline in-house
Why Choose DoseTrend?
We publish the price
£1,500 a month per molecule, on the website, before you speak to anyone. No discovery call just to learn whether you can afford it.
Both care settings
Primary and secondary care reconciled into a single view — the join most teams start and never finish.
Written by a person
The monthly briefing is written, not generated. Someone looked at your molecule and said what changed and why it might matter.
Honest about the limits
Open NHS data cannot tell you everything. Where it falls short we say so and point you elsewhere, rather than quietly selling around the gap.
Ready for the Full Dataset? Apply.
Full access is sold per molecule and granted by application — every ICB, every practice, primary and secondary care, with a written briefing each month. Not sure yet? Start with the free Snapshot and look at the data first.
Frequently Asked Questions
Common questions about DoseTrend.

Ready to See Your Molecule Clearly?
Start with the free Snapshot, or apply for full access. £1,500 a month per molecule, unlimited users across the company, cancel any month with no notice period.
DoseTrend is built and operated by Hotline Labs Ltd, a UK software company.